Chris Hodges
The key numbers:
- Resolution for key surface variables: 25 km → 5 km
- Forecast interval: 6 hours → 1 hour
- Spatial detail: up to 5× sharper
- Precipitation forecasts: up to 50% more accurate at horizons of 24+ hours
- Temperature and moisture: ~5 km resolution
- Other surface variables: ~10 km
- Some atmospheric variables: ~25 km
- Forecast coverage: global
- Updates: 24 forecasts per day
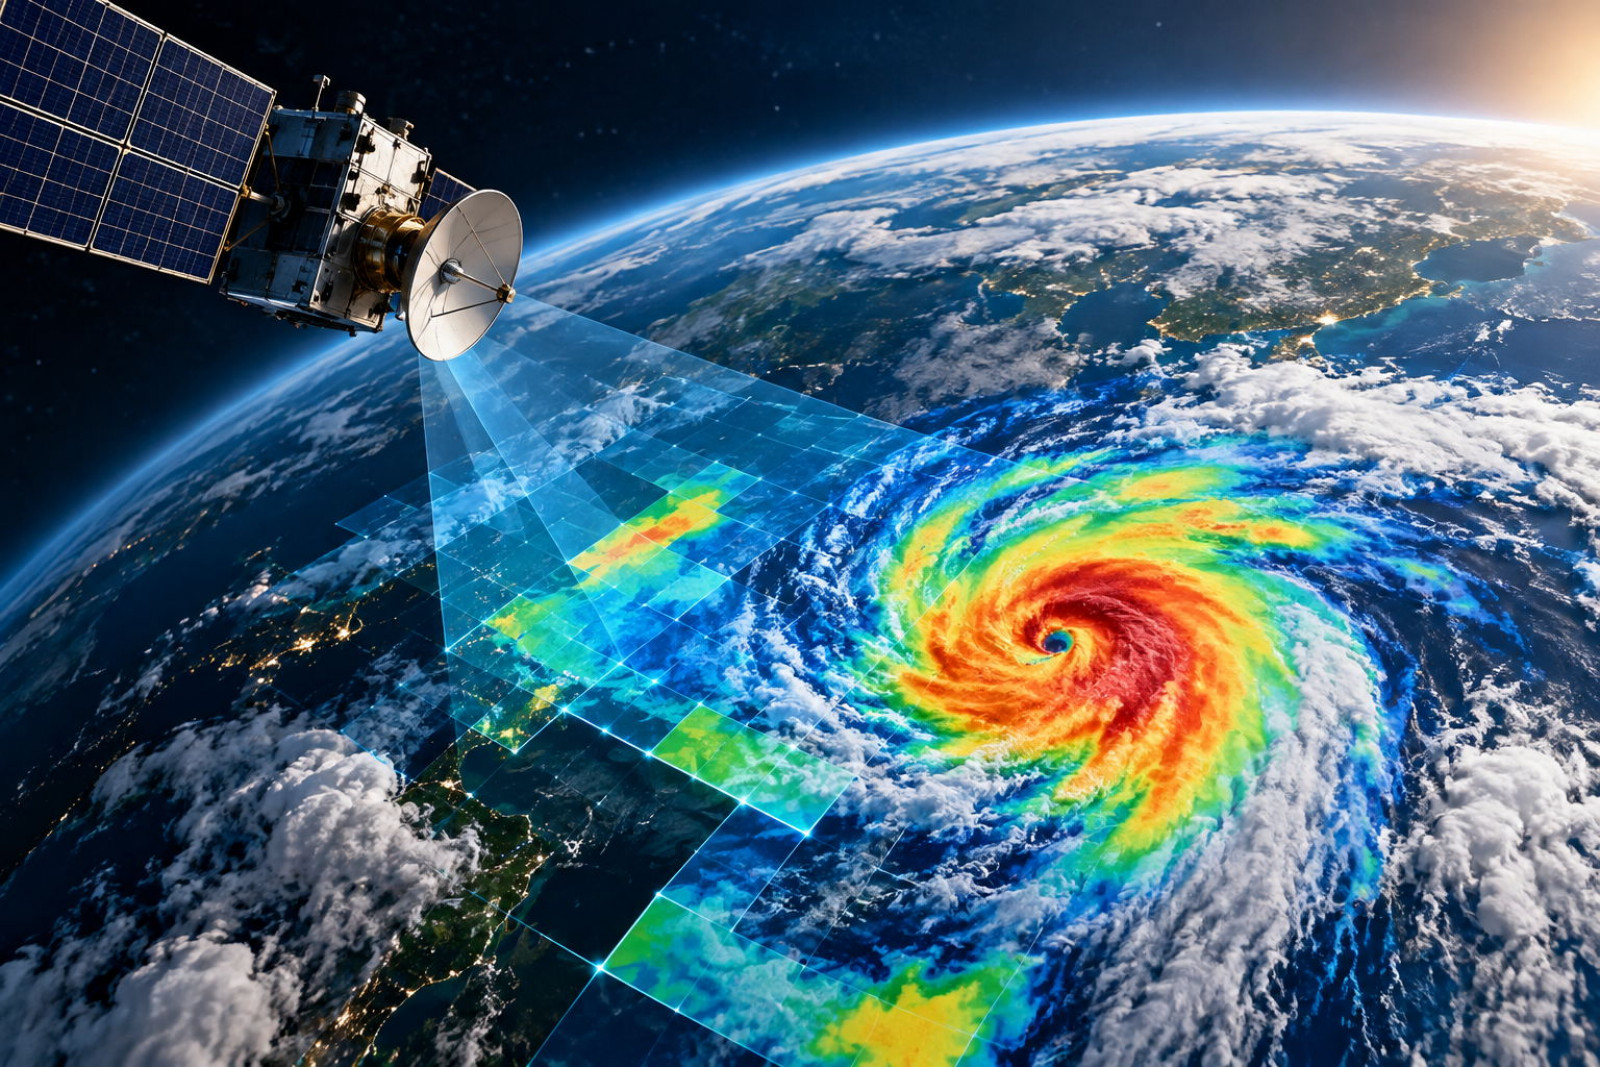
The biggest change, however, is not simply higher resolution. WeatherNext 3 can use live geostationary satellite observations as direct inputs, helping reduce the delay between observing atmospheric conditions and producing a new forecast.
From 25 km to 5 km
WeatherNext 2 operated at approximately 25 km resolution for key forecasts. WeatherNext 3 can predict important surface variables such as temperature and moisture at approximately 5 km. That is a fivefold increase in linear spatial resolution.
A simplified 100 × 100 km area illustrates the difference:
- 25 km grid: 4 × 4 = 16 cells
- 5 km grid: 20 × 20 = 400 cells
Another way to look at it is grid-cell area.
A 25 × 25 km cell represents roughly 625 km², while a 5 × 5 km cell represents just 25 km² — a 25× reduction in nominal cell area. This finer grid is particularly useful for precipitation, where conditions can vary dramatically across relatively short distances.
From 4 Forecasts a Day to 24
WeatherNext 3 also increases forecast frequency from six-hour intervals to hourly intervals.
That means:
- WeatherNext 2: ~4 forecast cycles per day
- WeatherNext 3: 24 forecast cycles per day
This 6× increase in temporal frequency matters for rapidly developing conditions such as rainstorms, fronts and changing wind patterns.
Traditional numerical weather prediction systems first collect observations from satellites, stations, aircraft, balloons and other sensors. These observations are processed through data assimilation before large physics-based simulations calculate how the atmosphere will evolve.
Google says this conventional pipeline can result in forecasts carrying a lag of up to around six hours. WeatherNext 3 approaches the problem differently.
Using Satellite Observations Directly
WeatherNext 3 can ingest observations from geostationary satellites directly and is trained using real-world surface and atmospheric observations. Geostationary weather satellites orbit approximately 35,786 km above Earth and continuously observe the same geographic region.
This creates a shorter conceptual forecasting pipeline:
1. Traditional approach:
Observations → data assimilation → atmospheric analysis → physics simulation → forecast
2. WeatherNext 3:
Observations → AI model → forecast
Traditional physics-based models remain essential to modern meteorology, but AI can substantially reduce the computational path between new observations and predictions.
This is one reason WeatherNext 3 can update its global forecast every hour.
Up to 50% Better Precipitation Forecasts
Precipitation is one of WeatherNext 3's biggest reported improvements. For forecasts one day or more into the future, Google reports precipitation predictions that can be up to 50% more accurate.
Higher resolution is particularly important here because rainfall is highly localized. Heavy precipitation can hit one area while a location only 10–20 km away receives considerably less.
Google says some of the largest improvements occur in regions where weather forecasting has historically been less accurate.
WeatherNext 2 vs. WeatherNext 3
| Metric | WeatherNext 2 | WeatherNext 3 | Change |
| Key surface resolution | ~25 km | ~5 km | 5× finer |
| Forecast interval | 6 hours | 1 hour | 6× more frequent |
| Forecasts per day | ~4 | ~24 | 6× more |
| Temperature/moisture | ~25 km | ~5 km | 5× finer |
| Other surface variables | ~25 km | ~10 km | ~2.5× finer |
| Some atmospheric variables | ~25 km | ~25 km | Similar |
| Direct satellite inputs | Previous architecture | Yes | Major change |
| 24h+ precipitation | Previous baseline | Up to 50% better | Major improvement |
The “5× sharper” claim therefore does not mean every WeatherNext 3 variable operates at 5 km resolution. Some atmospheric variables remain at approximately 25 km.
Why It Matters for Wind Power
WeatherNext 3 is also designed to support clean-energy forecasting.
Wind power is highly sensitive to wind speed. Before turbine limits and efficiency effects are considered, available wind power follows approximately:
Power ∝ wind speed³
For example:
- 8³ = 512
- 10³ = 1,000
So a relatively small difference in wind speed can correspond to a much larger difference in available wind energy.
Real turbines do not follow this cubic relationship across their entire operating range, but it demonstrates why accurate wind forecasts matter. More frequent forecasts can help wind-farm operators estimate future electricity production and help grid operators balance renewable supply against demand.
AI Changes the Computing Equation
Increasing the resolution of traditional numerical weather models is expensive. Moving from a 25 km horizontal grid to 5 km potentially increases the number of horizontal grid cells by roughly:
5 × 5 = 25 times.
Traditional models may also require shorter computational time steps at higher resolution, further increasing the processing requirements.
AI weather forecasting works differently. Training the model remains computationally expensive, but once trained, generating predictions can be significantly faster than repeatedly solving the complete set of atmospheric physics equations.
This could be particularly important for regions without access to the enormous supercomputing and meteorological infrastructure used by major national weather agencies.
Satellite observations provide global coverage, while AI can turn those observations into forecasts without requiring every country to operate its own state-of-the-art global forecasting system.
Already Coming to Google Products
WeatherNext 3 is moving directly into Google's consumer and developer ecosystem.
Its forecasts are being introduced across:
Google Search, Gemini, Google Maps and Google Maps Platform Weather API.
WeatherNext data is also available to researchers and developers through Google Cloud infrastructure, including BigQuery, Google Earth Engine and Cloud Storage datasets.
This gives the model applications beyond consumer weather forecasts, including agriculture, logistics, energy and research.
The Numbers Behind WeatherNext 3
WeatherNext 3 can ultimately be summarized by several figures:
- 5 km — resolution for key surface variables.
- 10 km — resolution for additional surface variables.
- 25 km — resolution for some atmospheric variables.
- 1 hour — forecast interval.
- 24 forecasts per day — versus roughly four with six-hour intervals.
- 5× — maximum increase in spatial sharpness versus WeatherNext 2.
- 25× — reduction in nominal grid-cell area when comparing 25 km with 5 km grids.
- Up to 50% — reported improvement in precipitation forecasts at horizons of one day or longer.
- ~35,786 km — altitude of geostationary satellites supplying observations that can be used by the system.
The technological shift is the combination of higher spatial resolution + hourly forecasts + direct satellite observations. WeatherNext 3 shows how AI could weaken one of the traditional trade-offs in meteorology: achieving higher resolution normally means requiring dramatically more computing power.
Google is now producing a global AI forecast 24 times per day, with some surface predictions at approximately 5 km resolution and precipitation forecasts that can be up to 50% more accurate beyond the first day.
 Chris Hodges